
Why I joined Wherobots
Sep 23, 2024
This past week, I started a new path in my career for the first time in 9 years over with the amazing team at Wherobots. There are a number of reasons why I am excited to join (the technology reasons will be explained below) but the first is the amazing team members I met this week at FOSS4G NA and those virtually as well.
Even for a new company with lots of work ahead, there is already a great culture of collaboration and alignment around the vision of where we are going. Some of that has to do with the history and community of Apache Sedona, but much of that also has to do with the clear vision and culture the team.
But it’s the unique combination of well designed open source technology along with a very noticeable gap in the spatial stack that is particularly interesting to me. The more time I had to talk to the team, the more that I realized that there is a strikingly unique opportunity - to build a scalable cloud based analytics solution for the planet's data, something that doesn't exist today, but something we need to solve the pressing problems facing our world today. We all know there is more spatial data than ever, but we need the right tools to really make use of it.
Apache Sedona
I’ll be the first to admit that I had only ever tested Sedona locally using the Docker installation so I never got to see the full power of Sedona with a Spark cluster. As Sedona has developed, I continued to see the building of a complete geospatial data processing platform at scale for both new and returning Spark users including:
- Vector data processing and functions
- Raster processing and functions
- H3 integrations
- Raster/vector combined analysis
- Ability to work with batch and streaming data (Apache Spark and Apache Flink)
- Connect to many data sources
- Blob data such as S3
- Data warehouses like Snowflake and BigQuery
- Streaming such as Kafka or Confluent
- Write code in Python or Spatial SQL
In short, Sedona provides capabilities like for both raster and vector data processing and when backed with Apache Spark, can scale to handle large workloads.
Apache Spark
All that said, using Sedona still requires the skills and access to work with Spark and a Spark cluster. Sedona has fast become Spark’s default geospatial toolkit, which means you also need to know how to run and tune spark clusters to make it very effective. I first heard about Spark in around 2015 when terms like MapReduce, Hadoop, and Hive were being thrown around as the big data processing systems. This was well out of reach of my technical depth but also sounded like a big task to set up, mainly aimed at data processing jobs not queries against data (keep that in mind it will be important later).
Spark of course came along and made that entire process much easier, however I definitely don’t have the skills to work with a Spark instance out of the box to set up, optimize, and maintain it. I was much more focused on the analytics side of things. The type of work I was doing was more or less why Databricks was created. They take the headache out of Spark so that you can just use the system to do the analytics or data science that you need to (what that ends up looking like in practice is data pipelines to continually provide analytical data, but again, more on that soon).
Wherobots provides a geospatially optimized serverless compute engine, so you don’t need to think about Apache Spark, or managing infrastructure. You just develop your spatial applications in Spatial SQL or python, or lift-and-shift workloads into it if they are compatible with Apache Sedona. Plus given the optimizations made to the compute infrastructure, you can immediately gain major speed improvements.
Spatial SQL and integrations
And yes, spatial SQL. As I was working on my book last year I was writing a section that outlined every tool that used spatial SQL to give a complete overview of what you can use with spatial SQL. Sedona was of course one of those, but it also had other connections to other parts of the modern GIS ecosystem.
From the Python point of view, that includes libraries like GeoPandas, Rasterio, and Shapely. And from the SQL side that includes tools like PostGIS, Snowflake, Iceberg, and more. What this means is that if you have your data invested in these tools already or if you are familiar with workflows in specific libraries, you an easily bring those into Sedona to take advantage of the scalability that exists there.
Cloud native files
One of the underlying principles within Apache Sedona and Wherobots is the ability to access and utilize cloud native geospatial file types, either in your cloud storage (this means no data migration) or in the WherobotsDB cloud storage. This includes Cloud Optimized GeoTIFFs, GeoParquet, as well as STAC or spatio-temporal asset catalogs.
One project that Wherobots is working on is to bring spatial support to Apache Iceberg, which enables database-like functionality on top of a data lake. As of today, Iceberg doesn't support spatial data types by default, so the team has developed an extension of Iceberg known as Havasu, which they are actively seeking to contribute back to Iceberg. This not only allows for the ability to have your files act as a table - meaning that you can insert, update, and delete data to that table - But it also adds additional performance capabilities around partitioning to dramatically increase query speed. This applies to storage within the Wherobots Cloud or you can bring your own cloud storage as well and connect with that.
Even better is the integration with the STAC catalogs. You can actually connect a STAC catalog as a out-of-database reference point, meaning that when you run an operation, it will actually call out to the remote raster tiles of that catalog and run their operations on those data sets rather than taking the time to ingest every single element of that catalog. Plus if you connect to an live endpoint, any updates will automatically be available to you.
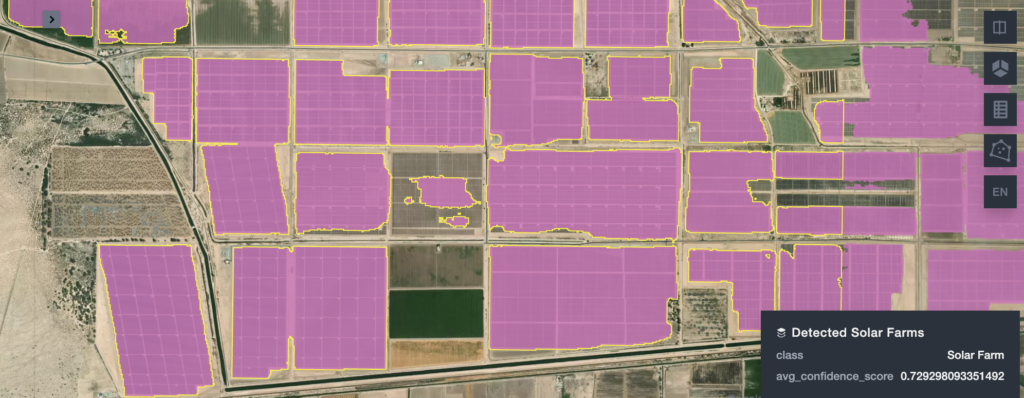
WherobotsAI Raster inference
Working across and using raw imagery to extract insights from has often been difficult. Even with the integration of new models, such as Segment Anything or even some of the YOLO models, this still can be a difficult process.
Additionally, there are a large number of models that have already been developed to work with geospatial data and to solve very specific problems when working on raw imagery. Wherobots recently integrated some of this functionality in a WherobotsAI raster inference with a model to detect solar farms.
But what's particularly interesting about the way this is set up is its ability to work with a specific model language reference for STAC catalog endpoints which is currently under development. From the project description:
The STAC Machine Learning Model (MLM) Extension provides a standard set of fields to describe machine learning models trained on overhead imagery and enable running model inference.
This means that any model that follows this pattern can be immediately brought in and used with the WherobotsAI functionality. Most production use cases for raster inference are supported by custom, highly tuned models, this functionality offloads that responsibility to the WherobotsAI functionality and the current existing models.
When you combine that with the ability to connect to any STAC catalog endpoint, this becomes particularly powerful for connecting to widely available imagery and immediately drawing insights from that data. This allows you to run the models over time to get access to true spatio-temporal insights.
Data processing in geospatial is not defined
All of this to say that if you take a look at the Modern Geospatial Data Stack there is a noticeable lack of definition in the ingestion, reverse ETL, and transformation categories. It is clear that we have solid definition in the data category as well as the storage category, but how we move and modify data is not well defined.

To be clear what I am talking about here is more than a simple file transformation or loading files one time into a database or another system, or even creating a more complex data pipeline that includes multiple files/joins/etc., but more complex data processing pipelines that have some of the following attributes:
- Scalability to work with any size of data problem
- Observability to understand if there are any issues in the data processing
- Repeatability to run on a specific event (time of day, data change, new file uploaded)
- Consistency in terms of outputs and results
- Temporal insights to understand change over time
Put another way, let’s imagine a scenario where I want to create a pipeline to extract data from the Snow Data Assimilation System (SNODAS) Data Products from the National Snow and Ice Data Center which provides daily data about snow and ice around the US.
Image Credit: awesome-gee-community-catalog
This allows us to measure snow depth, runoff, melt, and more. While there are plenty of practical applications for this data, I simply want to use this to monitor the snow depth of every ski town in the United States with data updating every day.
Now doing this one time is one problem. There are several steps to complete this but it is doable:
- Go out to the NSIDC FTP website and get the file for the most current data
- Download it and extract the data in the .tar file
- Find the specific file that you want to use (there is a file for each measurement listed here)
- Unzip the gzipped .dat file
- Use GDAL with a HDR file to translate the .dat file into a GeoTIFF
- Pull all the ski areas and resorts from Overture Maps into a file
- Intersect and perform zonal statistics to get the average snowcover for the pixels within a certain radius of the ski area
But if you want to repeat this over and over you need to create some sort of scalable data pipeline to manage that and run on a specific schedule. I have done this before using (each step corresponding to the step above:
- Go out to the NSIDC FTP website and get the file for the most current data
- Use Python to pull the file down and load it into local storage
- Download it and extract the data in the .tar file
- Python again to manage this step using packages to extract TAR files
- Find the specific file that you want to use (there is a file for each measurement listed here)
- Python, again to search for the specific file
- Unzip the gzipped .dat file
- Guess what again!
- Use GDAL with a HDR file to translate the .dat file into a GeoTIFF
- GDAL in Python to manage this transformation although I found a way to make it work with Rasterio
- Pull all the ski areas and resorts from Overture Maps into a file
- Use DuckDB to read that data and search across the Places data in SQL
- Intersect and perform zonal statistics to get the average snow cover for the pixels within a certain radius of the ski area
- Buffer the data in DuckDB to save a step and then use Rasterio to process the zonal stats to get the average
- Save the output files to cloud storage and clean up local storage
While all that is manageable, now making this run on a specific schedule is another problem altogether. A few options are:
- The first option is to use something like Airflow, Prefect, or Dagster to construct the pipeline in Python. You can manage the infrastructure yourself or orchestrate that using one of their cloud platforms (Astronomer, Prefect Cloud, or Dagster Cloud)
- Of course you can always do this on your own. I used GCP Cloud Run to manage the serverless infrastructure to spin up and shut down machines as needed
- But this of course needed a Docker container to manage the dependancies required for that pipeline and to host that in the Container Registry in GCP
- And then I needed a scheduler, aptly named Cloud Scheduler
To get to the point, what really struck me about Wherobots was their ability to handle this a pipeline like this, one with planetary scale data at high performance, without requiring infrastructure management:
- Reading in both the raster and vector data
- Saving the results in efficient Iceberg storage and tables
- Performing the zonal stats all in Spatial SQL
- Orchestrating the entire job pipeline
- And saving the output to PM Tiles as well
Why data retrieval tools aren’t the best for this
Okay yes but what about data warehouses? PostGIS? DuckDB? Why can’t they handle something like this? The tricky part is that they can to some degree, and also to some degree they are being used for things like this anyways. So it isn’t a hard no that they should not be used for this type of data pipeline. In fact at FOSS4G North America this past week we had a pretty in depth discussion about this.
Let’s break it down a bit one by one:
PostGIS
PostGIS for a long time has been the dominant spatial database with the largest number of spatial functions both for vector and raster data. It continues to advance over time, and is bolstered by the number of extensions and continued improvements within the spatial ecosystem, as well as the broader database ecosystem.
There are several reasons why PostGIS has limitations when it comes to scaled spatial analysis. One key issue is that storage and compute are bundled together, it uses row-based storage, and it lacks a lakehouse architecture. The primary reason, however, is that PostGIS is built as an Online Transactional Processing (OLTP) database. This design makes it ideal for handling operations like inserts, updates, modifications, deletions, and retrieving specific records efficiently. However, these characteristics are not well-suited for large-scale spatial analysis tasks.
Like I said, it's not that it can't be used for analytics. I wrote a whole book on the topic in fact, but it is most suitable for the types of queries where you need to identify very specific features.
DuckDB
DuckDB has become one of the fastest tools to be adopted in the spatial community that originated outside the spatial community in recent memory. In about a year and a half since the release of the spatial extension for DuckDB, It has now been featured in talks, both inside and outside spatial-centric conferences, and is being used in many different tools.
And there was a very good reason why. It requires next to no setup to get it up and running and you don't actually have to have a database or maintain a database to actually use it. It's fast at processing data at the most granular levels and allows you to work with any spatial file type within one single function. You don't have to move any data, it operates simply on your files. It provides a wide range of spatial functions, not the same depth as PostGIS, but many common analytical operations that you need to run.
And most importantly it is fast for a lot of different spatial operations. As an OLAP or online analytical processing database, it is optimized to do things like joins, window functions, and aggregates. Of course, the spatial join, with or without aggregation, is one of the most common spatial analysis queries.
The most common operations that we heard of DuckDB being used for at FOSS4G North America, were reading spatial files to perform data exploration and light analysis before taking further action with them, as well as using other tools such as the H3 extension as highlighted in the talk by Isaac Brodsky from Fused.
Of course you can provide additional power to DuckDB by adding additional computing resources or creating scalable serverless resources behind the scene for scale out use cases. Many times an individual or a small team wouldn't be doing this, but we have seen this start to grow in services like MotherDuck and Fused. I will get into why there is a difference between predictable compute pricing vs. scalable/on-demand compute pricing in the next section on data warehouses.
So are there any drawbacks? In my mind there are two. First is that as of today DuckDB’s compute engine isn’t specifically optimized for spatial query processing. This means that some queries will run slower if you compare a similar non-spatial query - much like the differences between vanilla Spark and Wherobots spatially optimized compute. The second is raster data. Sedona and PostGIS still remain the only two in this list that support both.
Data warehouses
The warehouses like Snowflake, Big Query, and Amazon Redshift, primarily focus on providing analytical queries on data that's prepared and ready to be analyzed. Those purposes, they are extremely well optimized - in fact many of them were built to analyze and query the increasing amount of machine generated data such as app and website interactions. This however differs from a data pipeline and processing pipeline. Let's take two examples of what looks like.
Let's take an example of large-scale transportation data analytics. Imagine that you're working for an organization that collects and analyzes millions of GPS points and trips that come into your system every single day. This could be into the gigabytes of data that you receive, but at the core you receive a large amount of data daily.
In an analytical query, you may want to ask questions such as what is the average speed on the roads in this area on this day? How many cars or vehicles are traveling on this road on this day? As the speed changed or decreased in the last 30 days? Did weather play a factor? How many accidents were observed? How did traffic jams change, increase, or decrease during the period?
The questions are best to ask on data that is already processed, meaning that you would generally want some of this information and data encoded at the road segment level. You may have some observation for every day, being that each road segment has a day time stamp speed car count listed for that specific road segment. This requires a lot of ETL to support these types of interactive queries.
And in an analytical query, you would have a question about the road segments in a specific area - what do these averages, counts, speeds look like?
What you definitely don't want to do is process and ask those questions on the raw data that you have and the road segments since you would have to do the joins and map matching each time a query is run.
To draw a parallel to other industries, many data warehouses provide analytics to marketing teams. This includes data that is raw interactions, maybe from a website, e-commerce, mobile applications, etc. It is the data engineer's job to properly prepare that data for the marketing team to answer those analytical questions.
The data warehouse that I mentioned above are, in fact, fantastic at answering those types of questions. They are not, however, as efficient in processing the raw data, specifically when it comes to geospatial data.
This comes down to the compute structures that I mentioned above. Most data warehouses use an on-demand compute structure, meaning that it will spin up and allocate the proper amount of compute for the query at the time the query is running. As the user, you may or may not have controls over this and in fact it is generally on the user or the IT administrator to put in the logical barriers to running very expensive queries.
But this allows teams to ask these types of questions and usually shift the date ranges backwards or forwards or look at different metrics that they care about.
However, for the data processing pipeline, this is a different type of need for a different level of compute. Dealing with the problems such as creating statistics and aggregates from raw GPS data to different road segments, you will generally want a dedicated set of compute at a specific time. By knowing the amount of compute that you need and the time that it will take the process you could generally have more price predictability rather than using an on-demand system.
What is particularly interesting about Wherobots is that it not only provides that type of structure, but it also provides different scales of compute, and most importantly, compute that is optimized for spatial data. And this is combined with WherobotsDB, the data lake architecture and data partitioning underneath the hood, this can be a monumental time and cost savings.
Databricks
Databricks provides the most apples to apples comparison when it comes to data processing. It runs similarly to Wherobots as a distributed analytics engine on data in your cloud storage buckets. In fact, many of the initial Wherobots customers actually ran their spatial workloads on Databricks using Apache Sedona. As of now, Databricks only supports spatial operations using H3 and most users are using Sedona for their spatial analysis in Databricks. It certainly has scalability, but it still is not optimized for spatial.
What’s ahead
One thing that I've always enjoyed working on and discussing is showing how you can start to work with spatial data in new ways, but also scale that up to nearly unlimited scale. I really believe that the combination of using modern tools plus the ability to work with data at scales that you need to is incredibly important. On top of that, having the ability to automate these processes and deliver insight is something that will help us break out of the cycle of geospatial being a project-based only workflow.
As I continue to learn and grow, I hope to show how Apache Sedona and Wherobots can be a key solution within this space to help solve not only the problem of data scale, but also automation. However, I also recognize that there are many different places where this level of scale may not be needed. I want to continue to work on providing insights for every different level of every different operation within geospatial to help you continue to learn and grow within your careers and also automate and scale your impact within whatever toolkit you're working in.
Long story short, I'm excited about this new journey and I hope to bring many new insights and information to you as I discover them along the way.
Get the Spatial Stack Newsletter sent right to your inbox.
We hate spam. We will never sell your information, for any reason.